Images from Overlooked and Undercounted 2012

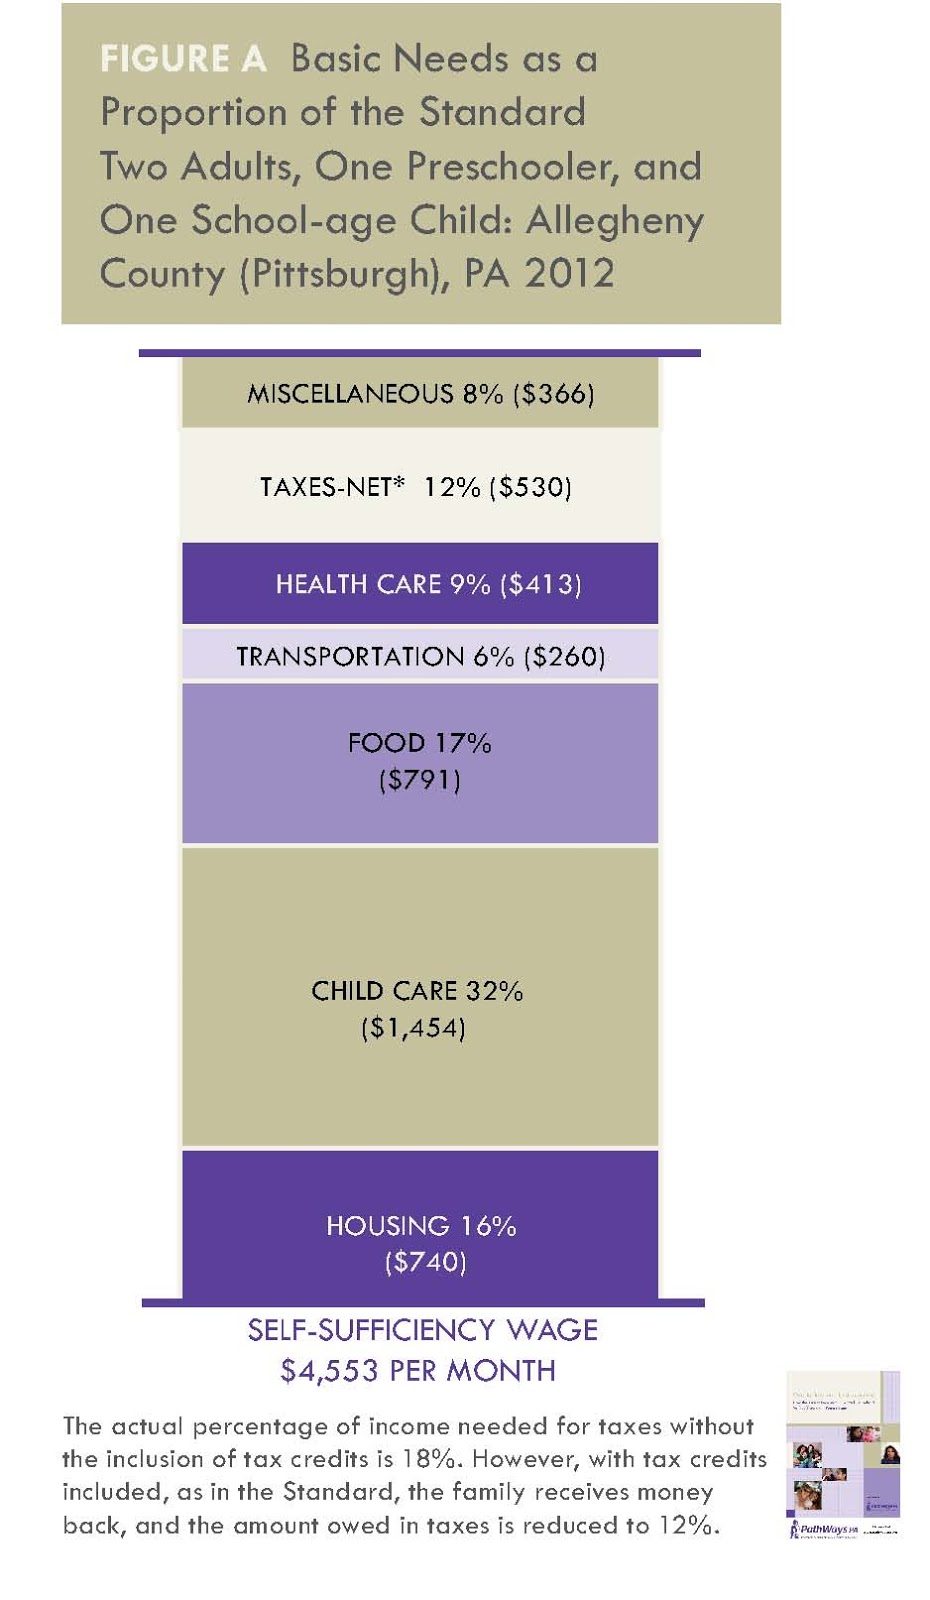
Figure A shows an example of the Self-Sufficiency Standard, with each monthly expense included in as a proportion of the total income necessary for a family with two adults, one preschooler, and one school-age child in Allegheny County.

By far, housing and child care combined are the most expensive costs for families.

Families with children (when one or more children are under school-age) generally spend about half their income on housing and child care expenses alone.


The map (Figure B) highlights that the cost of meeting basic needs also varies geographically in Pennsylvania. The 2012-2013 Self-Sufficiency Standard for one parent with one preschooler ranges from $25,697 to $53,410 annually.


The Self-Sufficiency Standard has stayed about the same since 2010 in each of the places shown for this family type in Figure C. The two largest budget items, housing and child care, had only modest changes since 2010.

Since the first edition of the Pennsylvania Standard in 1997, the Self-Sufficiency Wage for an adult with one infant and one preschooler has increased by over 67% in each of the four places shown in Figure C.

While considerable percentages of Pennsylvania households in all racial/ethnic groups have income below the Self-Sufficiency Standard, people of color have the highest rates below the Standard (Figure F).


The risk of inadequate income increases by more than two-thirds for households with children compared to those without children, from 20% to 35%. The number of children also varies: families with one child have an inadequacy rate of 27%, those with two children, 34%, and those with three or more 56%.


As can be seen in Figure J, married couples have the lowest rates of income inadequacy, and female householders the highest. Among households with children, there is an even greater difference by both family type and gender of the householder.

Married-couple households have the lowest rate of income inadequacy at 24%. Income inadequacy increases for single father households, with 41% lacking adequate income. As stated above, the highest rate is that of single mother households, nearly two thirds of whom lack adequate income (65%).


The combination of being a woman, having children, and solo parenting are associated with some of the highest rates of income inadequacy. At the same time, as we have seen above, rates of income inadequacy are quite high among some race/ethnic groups. When these factors, household type (including gender and children) and race/ethnicity, are combined, there is an even greater disparity between groups in rates of income adequacy. That is, within racial groups, household type differences remain, with single mother households consistently having the highest rates of income inadequacy. At the same time, among households of the same composition, racial and ethnic differences remain, with Latinos consistently having the highest rates of income inadequacy

Although increased education raises income adequacy levels for all race and gender groups in Pennsylvania, four patterns are apparent when we examine the impact of education broken down by race and gender. 
  1. As education levels increase, income adequacy rates increase more dramatically for women than for men, especially women of color. Thus, the relationship between higher education and relatively higher levels of income adequacy are greatest for women of color, followed by White women. In fact, when the educational attainment of the householder increases from a high school degree to a Bachelor’s degree or higher, income adequacy levels rise from 33% to 76% for women of color, and from 67% to 87% for White women. In contrast, men have higher rates of income adequacy at the lowest levels, with men with less than a high school education, already at an income adequacy rate of 51%—compared to 25% for women lacking a high school degree—and thus men experience less of an increase with increased education.
  2. As educational levels increase, the differences in income adequacy rates between men and women of the same race/ethnicity narrow. This is most apparent for White women: Figure L shows that 36% of White women with less than a high school degree have adequate income whereas over half (57%) of White males with less than a high school degree have adequate income. This gap decreases as education increases, so that the difference in income adequacy between White women and White men who hold a Bachelor’s degree or higher declines to only about four percentage points. A similar pattern is apparent for people of color: the gap between men and women of color declines as education increases, from a 27 percentage point gap between non-White male and female householders with less than high school degree to only a 5 percentage point gap for non-White male and female householders with a Bachelor’s degree or higher.
  3. Although less dramatic, within gender there also is a race-ethnicity-based pattern that is similar, with the gap in adequacy rates between White and non-White householders below the Standard narrowing as education increases. While the income adequacy rate for men of color remains about half that of White men at each educational level, the percentage point gap decreases from 21 percentage points between men of color and White men with a high school education to 10 percentage points between White men and men of color with a Bachelor’s degree or more. For women there is a similar decline in the difference between White women and women of color as education increases to a Bachelor’s degree or higher. Interestingly, within both genders, the percentage point gap between White and non-White householders with less than a high school degree is smaller than for those with a high school degree.
  4. The disadvantages experienced by women and/or people of color are such that these groups need more education to achieve the same level of economic self-sufficiency as White males. While 79% of White males with only a high school diploma are above the Standard, only 33% of women of color with just a high school degree have adequate income. Obtaining some college or an associate degree increases that rate to 43%, and getting a Bachelor’s degree increases it to 76% or higher for women of color. In short, even attaining a Bachelor’s degree or more, women of color still have a lower rate of adequate incomes than White males with only a high school degree.


    Three out of four Pennsylvania households with no employed adults (households in which no one over age 16 has been employed in the past year) lack sufficient income. On the other hand, only about one in three households with one worker, and one in seven households with two or more workers, have an income that falls below the Standard. This pattern is the same across race/ ethnic groups but the impact of no workers in a household is magnified for people of color.


    Figure N compares the 20 most frequently held occupations of householders below the Standard to the 20 most frequently held occupations of those who are above the Standard. The first finding is that householders below the Standard are somewhat more concentrated in a few occupations: the top 20 occupations cumulatively account for 40% of all householders below the Standard, compared to 33% for the top 20 occupations of those above the Standard.

    In contrast, the more striking observation is the degree of overlap in occupations above and below the Standard: nine occupations are shared between the top 20 above and below the Standard (occupations that are most common among households below and above the Standard are shown as overlapped in the figure). At the same time, the wages are quite different.

    Overall, the earnings of householders above the Standard average more than three times those below the Standard.

    The top 20 occupations of women householders below the Standard account for more than half (51%) of employed women householders below the Standard. At the same time, women householders below the Standard share 12 occupations with women householders above the Standard, reflecting the higher levels of gender segregation in the economy as a whole; these shared occupations (of women above and below the Standard) account for close to two-thirds (63%) of women householders below the Standard. Additionally, women below the Standard share only five of the top 20 occupations with men below the Standard, and women only share seven occupations with all householders above the Standard.


    While the likelihood of experiencing inadequate income in Pennsylvania is concentrated among certain families by gender, race/ethnicity, education, and location, families with inadequate incomes are remarkably diverse.
    • In terms of race and ethnicity, 67% of households in Pennsylvania with inadequate income are White, 19% are Black, 10% are Latino, and 4% are Asian/Pacific Islander.
    • U.S. citizens head 90% of the households below the Self-Sufficiency Standard.
    • Just over half (54%) of households below the Standard have children.
    • Of the households below the Standard in Pennsylvania, 25% are married-couple households with children, 24% are single-women households with children, 5% are single-male households with children, and the remaining 46% of the households below the Standard are family households without children and non-family households (also without children). A never-married mother heads only 13% households below the Standard in Pennsylvania.
    • Among Pennsylvania householders in families with inadequate income, 14% lack a high school degree, 39% have a high school degree, 31% have some college or an Associate’s degree, and 16% have a Bachelor’s degree or higher.
    • About 79% of Pennsylvania households with inadequate income have at least one employed adult. Over half (51%) of Pennsylvania households with insufficient income have one worker, and 27% have two or more workers.
    • Only 8% of households with inadequate income receive public cash assistance. However, nearly one in three (31%) households below the Standard participated in the Supplemental Nutrition Assistance Program (SNAP, formerly food stamps), reflecting the broader experience of this program during the Great Recession.
    • About three out of four Pennsylvania households below the Standard spend more than 30% of their income on housing.
    • Of Pennsylvania households below the Standard, more than one in four (27%) do not have health insurance coverage.

    Altogether, with work schedules not that much different between those above compared to those below the Standard, the difference in average hours worked is not significant either. Of  householders who work, those above the Standard work about 18% more hours per year than those below the Standard (a median of 2,080 hours versus 1,760 hours per year).

    However, wage rate differences between those above and below the Standard are substantially greater: overall, the average hourly wage rate of those above the Standard is more than twice that of householders below the Standard ($21.37 per hour versus $9.62 per hour). Because the wage differences by race and gender are larger for those above the Standard than for those below, this wage gap is somewhat less for people of color, women, and family households headed by women. But even within these groups, wages would have to be at least doubled in most cases to match the median wage of householders above the Standard.

    This means that if householders with incomes below the Standard increased their work hours to the level of those with incomes above the Standard, working about 18% more hours, but at the same wage rate, the additional pay would only close about 21% of the earnings gap. If those with insufficient income were to earn the higher wage, however, with no change in hours worked, the additional pay would close 77% of the gap.

    This data suggests that addressing income adequacy through employment solutions would have a greater impact if it were focused on increased earnings rather than increased hours.


    Comments

    Popular posts from this blog

    PathWays PA E-Newsletter: August 6, 2012

    Mini-Budget Update-Supporting the American Community Survey

    Overlooked and Undercounted: Struggling to Make Ends Meet in Pennsylvania